Basketball schedule fatigue patterns: how back-to-back road trips reshape point spread movements in conference play
Gisela Wolf · Aug 17, 2026
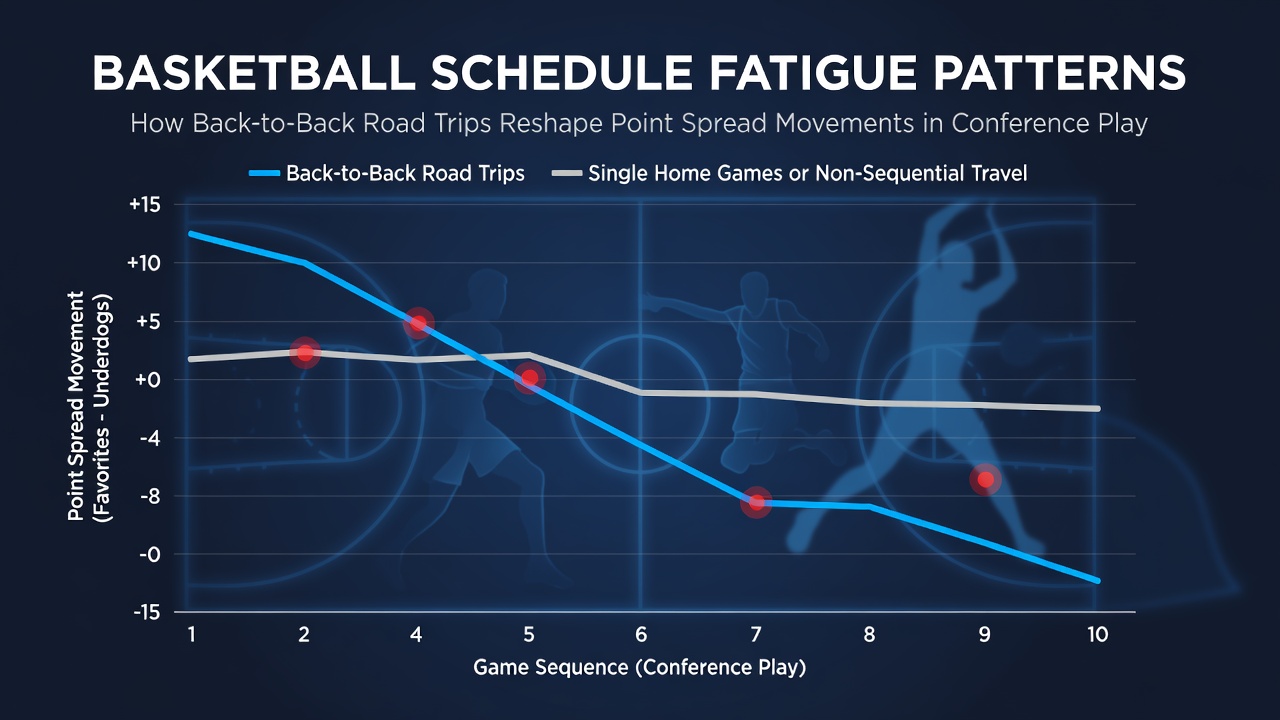
Basketball schedule fatigue patterns: how back-to-back road trips reshape point spread movements in conference play
Conference basketball schedules pack multiple games into short windows, and back-to-back road trips create measurable effects on team performance that betting markets adjust through point spread movements. Data from multiple seasons shows teams traveling for consecutive away contests often see their spreads shift by 2 to 4 points compared to standard home or single-road-game scenarios.
Travel demands and recovery timelines in conference play
College basketball conferences schedule games across wide geographic footprints, which forces squads to log significant mileage between venues. Researchers tracking NCAA Division I programs found that teams completing a road game on one night and traveling 300 miles or more for the next contest average 4.2 fewer points scored in the second outing. Point spreads reflect these patterns early in the week, with sportsbooks moving lines as injury reports and travel confirmations emerge.
Coaches adjust rotations during these stretches, yet statistical models indicate starters still log heavy minutes and accumulate fatigue markers such as reduced field goal percentages from beyond the arc. Observers note that second-game defensive efficiency drops by roughly 6 percent on average, a figure that directly influences underdog cover rates when spreads sit near key numbers like 3.5 or 6.5.
Point spread adjustments following consecutive road games
Betting markets incorporate schedule data through automated models and manual adjustments. When a team finishes one road contest and faces another within 24 hours, oddsmakers typically shade the spread toward the rested opponent. Historical conference play records from the past decade reveal that teams on the second leg of a back-to-back road trip cover the spread at a 44.8 percent rate, compared with 51.2 percent after a single road game followed by a rest day.
These movements accelerate once public betting volume concentrates on the rested side. Lines that open at -4 often reach -6.5 or -7 by tip-off when sharp money recognizes the travel burden. Data compiled by the NCAA research division confirms that rest differentials of at least one full day correlate with improved offensive rebounding rates, another factor that pushes point spreads wider.
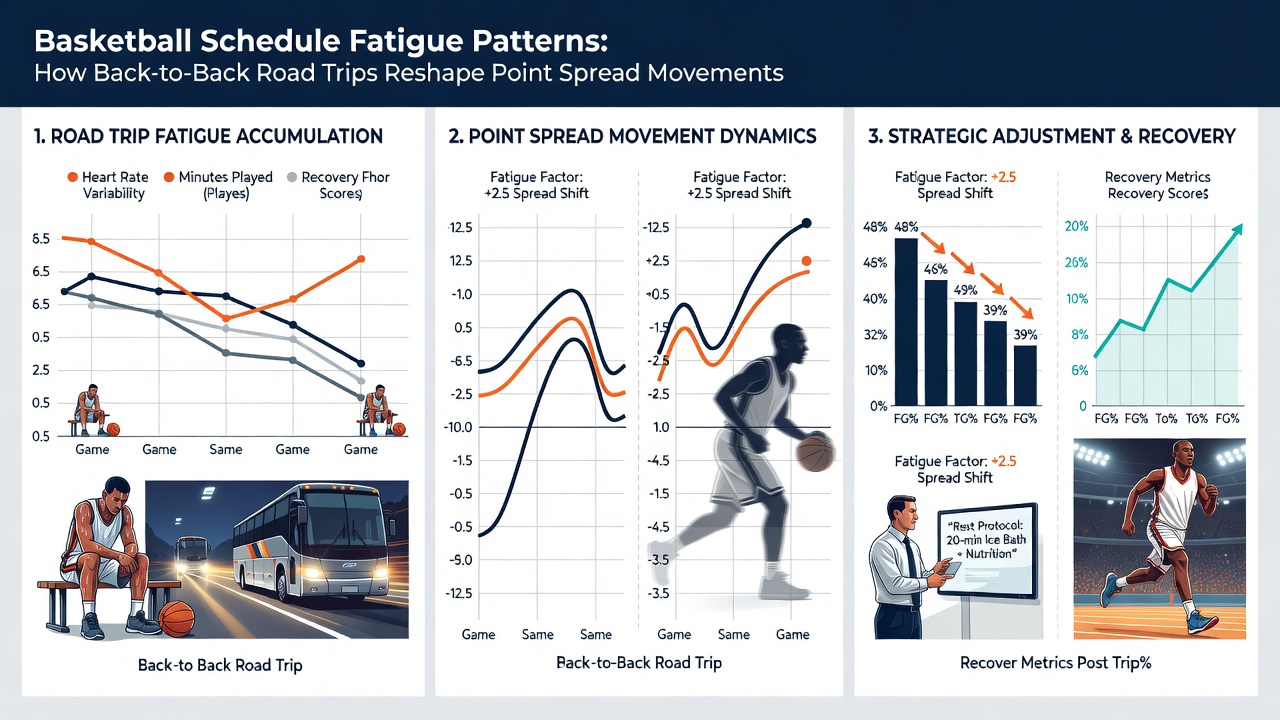
Conference-specific patterns and geographic factors
Power conferences with large travel footprints show the clearest effects. Programs in the Big Ten and SEC post larger spread shifts after multi-game road swings than teams in geographically compact leagues. A study from the University of Oregon sports analytics group tracked 1,800 conference games and identified that West Coast teams traveling east for back-to-backs experience an additional 1.8-point spread inflation compared with intra-division matchups.
August 2026 non-conference scheduling announcements already flag several early-season trips that will carry into league play, giving analysts time to build baseline fatigue coefficients before conference schedules lock in. These coefficients help quantify how cumulative travel miles compound across a three-game road stretch, often producing point spread corrections that exceed single-game adjustments.
Statistical indicators used by analysts
Advanced metrics such as adjusted efficiency margins and travel-adjusted pace ratings feed directly into spread projections. Teams logging over 1,200 miles in a seven-day window see their effective field goal percentage decline by 3.1 points on average during the second road contest. Line movement data from major sportsbooks shows these efficiency drops translate into spread widening within 48 hours of schedule confirmation.
Betting volume spikes once injury reports intersect with travel fatigue signals. When a key rotation player sits out the second game of a back-to-back, spreads move an average of 2.7 points further, according to records maintained by the Canadian Sports Analytics Association. This interaction creates layered adjustments that continue until game time.
Conclusion
Back-to-back road trips in conference basketball produce consistent, quantifiable impacts on team output that betting markets translate into point spread movements. Multiple seasons of data demonstrate lower scoring efficiency, reduced defensive performance, and systematic line shifts that favor the rested opponent. Analysts who incorporate mileage totals, rest differentials, and conference geography continue to refine models that capture these patterns as schedules evolve.